
Survey Earnings Calculator
Calculate Survey Earnings
Real-time income modelling · disqualification · fees · tax
Community-reported average rates. Your results will vary by country, profile & survey availability.
| Platform | Avg. Hourly | Min. Payout | Reliability | Payment Methods | Targeted Countries | Best For |
|---|---|---|---|---|---|---|
| Respondent | $25 – $150 | $50 | Selective | PayPal, Tremendous | US, UK, CA, AU | Professionals / UX research |
| UserTesting | $10 – $60 | $10 | Selective | PayPal | US, UK, CA, AU | App & website feedback |
| User Interviews | $5 – $25 | $10 | Selective | PayPal, Gift Card | US, UK, CA | In-depth 1:1 interviews |
| Focus Group Inc | $5 – $15 | $10 | High | PayPal, Check | US, CA | Focus groups & panels |
| Prolific | $8 – $12 | £5 | High | PayPal, Circle | Global | Academic research |
| CloudResearch | $7 – $10 | $1 | High | PayPal, Bank | US | Quality tasks & studies |
| Pinecone Research | $3/survey | $3 | High | PayPal, Check, GC | US, UK, CA, DE | Fixed-rate product surveys |
| Branded Surveys | $4 – $7 | $5 | Medium | PayPal, Gift Cards | US, UK, CA, AU | Loyalty streaks & bonuses |
| Survey Junkie | $3 – $6 | $5 | Medium | PayPal, Bank Transfer | US, AU, CA | Pure surveys, clean UX |
| InboxDollars | $2 – $5 | $30 | Medium | PayPal, Check, GC | US | Surveys + videos + games |
| Swagbucks | $2 – $5 | $3 | Medium | Gift Cards, PayPal | Global | Variety tasks & offers |
| MyPoints | $1 – $4 | $3 | Medium | Gift Cards, PayPal | US | Surveys + shopping rewards |
| Toluna | $2 – $4 | $10 | Medium | PayPal, Gift Cards | Global (50+ countries) | International audiences |
| Ipsos i-Say | $2 – $4 | $5 | Medium | PayPal, Gift Cards | US, UK, CA, FR, DE | Brand & consumer research |
| YouGov | $1 – $3 | $50 | Medium | PayPal, Gift Cards | Global (40+ countries) | Political & social research |
| LifePoints | $1 – $3 | $5 | Medium | PayPal, Gift Cards | Global (30+ countries) | Lifestyle & consumer panels |
| Opinion Outpost | $1 – $3 | $5 | Medium | PayPal, Amazon GC | US, UK, CA, AU | General consumer surveys |
Find out exactly how many surveys you need to hit your income target.
How long to reach common savings targets based on your inputs above.
How it Works
Platform Preset Dropdown
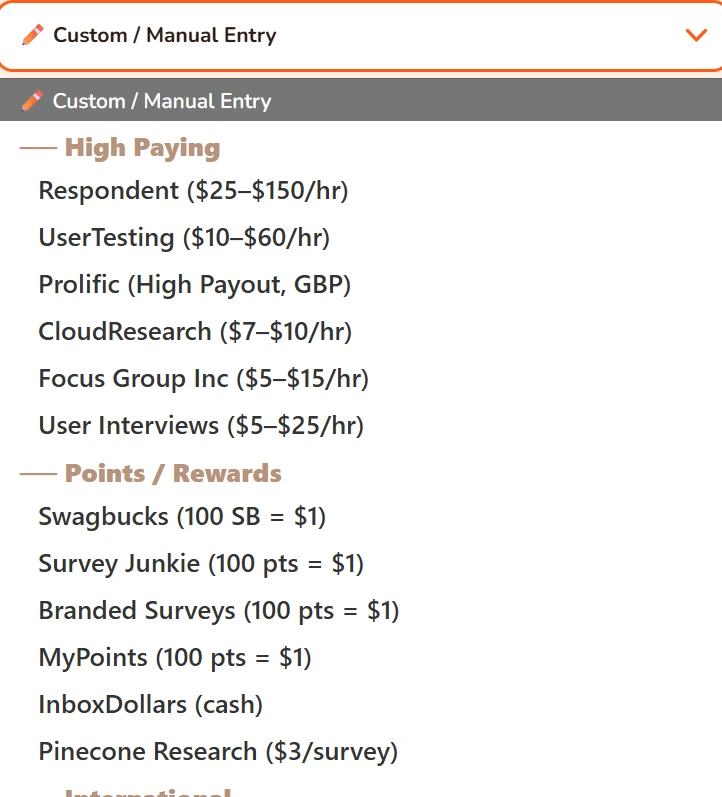
Right at the top, there’s a dropdown labeled “Platform Preset”. This is a shortcut; I’ve pre-filled values for popular survey platforms based on what real users report.
For example, if you select Prolific, it’ll set a high availability, low disqualification rate, and decent payout. If you select Respondent, it’ll set a much higher payout but also a higher disqualification rate (because those studies are competitive).
Here’s the thing, these are just starting points you should still tweak the numbers below to match your actual experience. But if you’re new to a platform, picking the preset gives you a realistic baseline.
Core Inputs
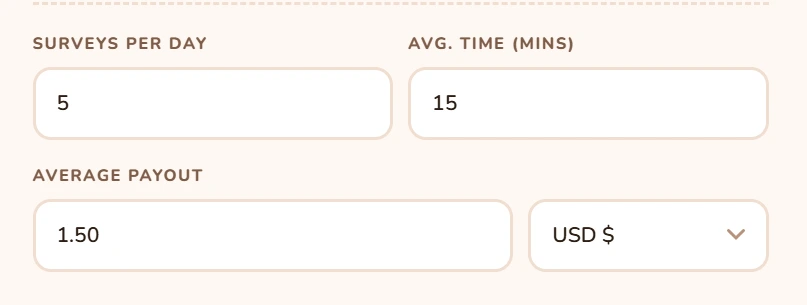
- Surveys Per Day: How many surveys do you typically attempt in a day? If you only do one or two, put that.
- Avg. Time (mins): The average length of the surveys you actually complete. If some take 5 minutes and some take 25, split the difference, I usually put 15 as a default.
- Average Payout: Here’s you have two options: USD or Points, most platforms pay in dollars, but some use points systems (like 100 points = $1). Use the dropdown to switch.
If you pick USD, just type the dollar amount you typically get per survey. If you pick Points, type the points you earn, and then in the field that appears below, enter how many points equal $1. For most platforms, 100 points = $1, but check your specific site.
Realistic Adjustments
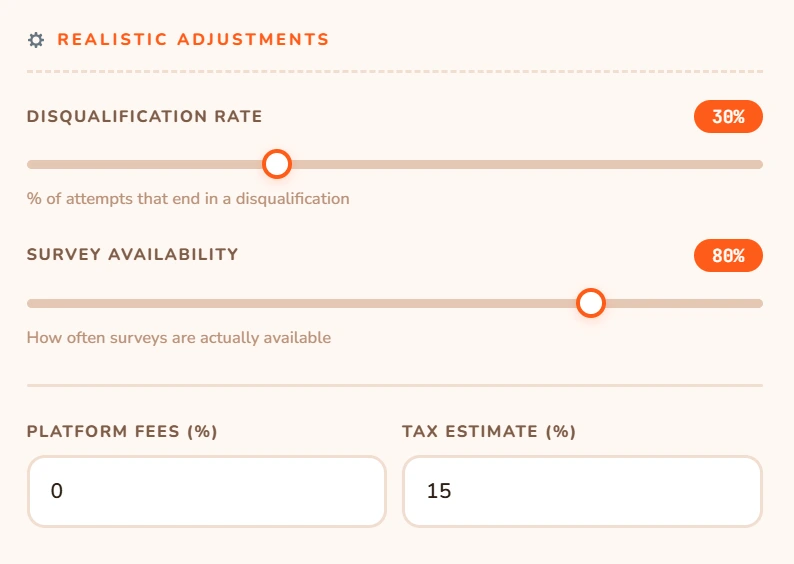
These sliders adjust for all the stuff that eats into your earnings.
Disqualification Rate: You know when you start a survey, answer five questions, and then it says, “thank you, you don’t qualify”? That’s disqualification, you just wasted time and got nothing.
This slider lets you estimate what percentage of your attempts end like that. If you get disqualified from 6 out of 10 surveys, set it to 60%. Move it up or down based on your experience.
The calculator assumes each disqualification wastes about 2 minutes of your time (the screening questions). That time is factored into your hourly rate.
Survey Availability: Sometimes you log in and there are zero surveys or only low-paying ones you skip. This slider estimates how often surveys are actually available when you check.
If you can find surveys 4 out of 5 days, set it to 80%. If you’re in a country with fewer opportunities, you might drop it to 50% or less.
Platform Fees (%): Some sites take a cut when you cash out, maybe a small transaction fee. If you know yours, put it here, most are 0%, but things like PayPal fees can apply.
Tax Estimate (%): In many countries, survey income is taxable if you earn over a certain amount. I put 15% as a default but adjust based on your situation. If you don’t pay taxes on this income, set it to 0.
The Results Side
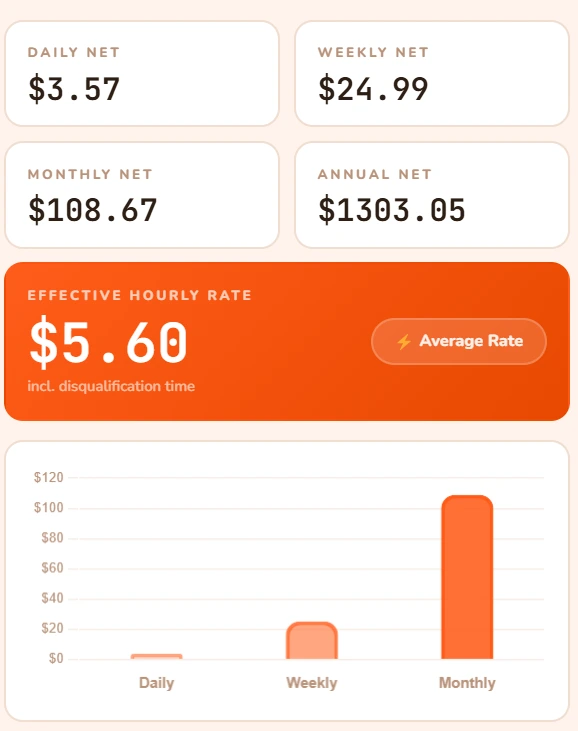
- Daily Net, Weekly Net, Monthly Net, Annual Net: These are your earnings after disqualifications, availability, fees, and taxes. The annual number is just daily multiplied by 365. It’s rough but gives you a perspective.
- Effective Hourly Rate: This is the most important number. It’s what you actually earn per hour, including all the time spent on disqualified surveys and waiting for available surveys.
Below that, you’ll see a little colored chip:
- Great Rate! (green) if over $10/hr
- Low Return (red) if under $5/hr
- Average Rate (yellow) if between $5 and $10
This tool is meant to give you a realistic picture. Not the fantasy “I’ll make $1000 a week” nonsense you see on some blogs, real numbers based on real inputs.
The defaults are conservative. If you’re in the US, have a complete profile, and check multiple times a day, you can probably beat them. If you’re in a smaller country or only check occasionally, you might need to lower expectations.
Play with the sliders and see what happens when you drop disqualification from 30% to 15%. That’s the power of a complete profile right there.
And remember the calculator is only as good as the numbers you put in, be honest, and it’ll help you make better decisions.